Bike and Scooter Share Schemes are Still Growing

Latest data from North America and Europe all suggests that bike and scooter share schemes are still growing, with no end in sight.
The North American Bikeshare & Scootershare Association (NABSA) is a nonprofit created to provide resources, education, and advocacy for the shared micromobility industry. The organisation has 78 members in six countries and produces a very detailed annual report that focuses on the US, Canada and Mexico. You can download their latest report, which was released on 10th August 2023 and reports to the end of 2022.
Here are some highlights from that report.
- The number of North American cities with at least one bike share or e-scooter share system grew by 35% to 401.
- Of these 401 cities, 121 cities had both bike and e-scooter share schemes.
- The number of trips rebounded to the pre-Covid level of 157 million for the year, but the number of shared vehicles is now higher at 289,000 compared to 194,000 in 2019, meaning that rides per vehicle per day has reduced to 1.48.
- The number of systems with e-bikes or e-scooters, as opposed to only ‘acoustic’ bikes, has increased significantly over the past three years.
- People ride shared micromobility for a wide range of reasons: 33% for social activities, entertainment and dining out, 27% for exercise and recreation, 25% for work or school commuting, 15% for shopping, errands and appointments.
- The North American shared mobility sector employs at least 8,100 people, equalling one job for every 36 shared vehicles.
- There were 118,000 share bikes and 172,000 share e-scooters deployed in total. Of the share bikes, only 12% were dockless and the rest docked. Thirty-five percent were e-bikes and 65% acoustic bikes.
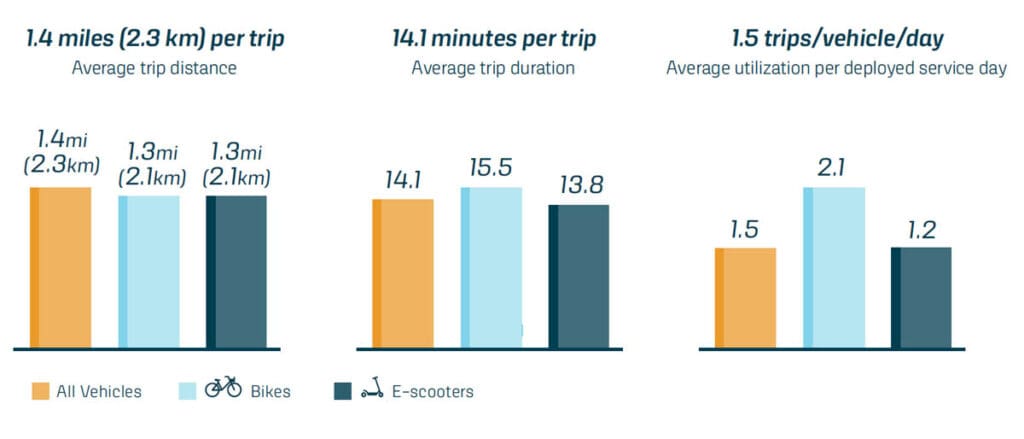
- Average journeys are short in both time and distance, as detailed in the following chart:
E-Bikes Growing Fastest
Within the share bike sector, e-bikes are growing fastest.
- The number of e-bikes in share fleets grew by 71% year on year.
- E-bikes were ridden 56% percent more than acoustic bikes in systems that have both.
- E-bikes were ridden 3.1 km per journey on average compared to 2.3km for acoustic bikes.
- Both e-bikes and e-scooters attracted more hires per vehicle per day in large cities than in small or medium cities.
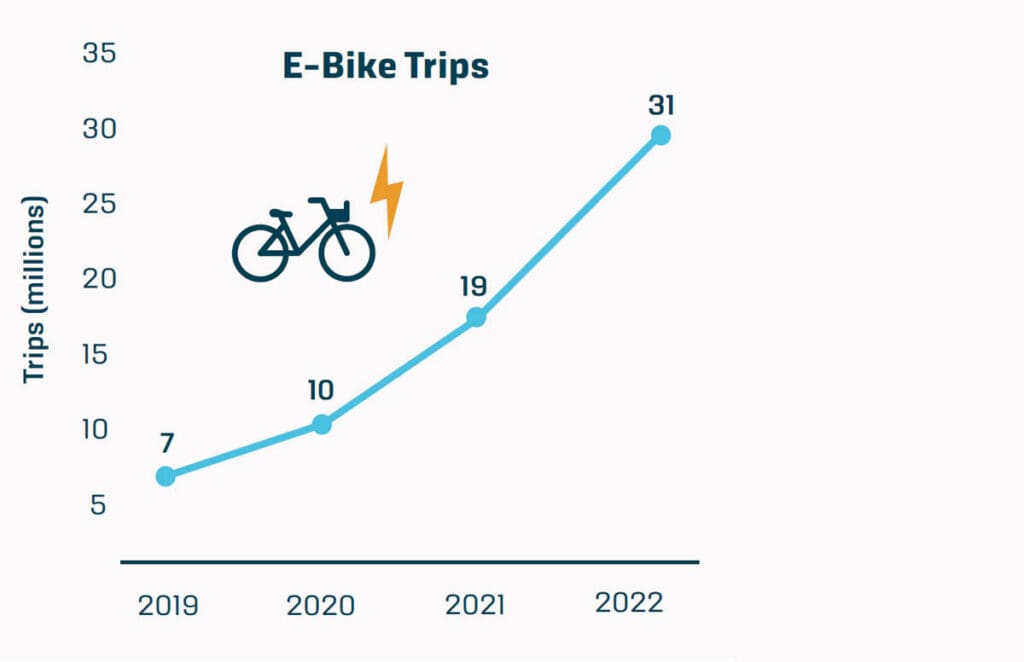
- The total number of e-bike share trips is growing at an accelerating rate, as you can see from the table below:
Rich, Young, White and Male
The report includes a very interesting chart tracking who is riding share bikes and scooters and then comparing it to the overall population demographics.
In summary, those earning over US$100,000 (A$156,000) per annum are 18% over-represented in terms of ridership and those earning US$15,000 to US$49,999 (A$23,400 to A$78,000) are the most under-represented at minus 17%.
The report does not speculate on why this is, but in most cities it’s the wealthy who can afford to live in the densely populated city centres which are best served by share schemes and the ‘working poor’ tend to live in poorer suburbs that are less well served.
Meanwhile, the peak age range was 24-44 years old, which was 18% over-represented, and the lowest was 65 plus, which was 14% under-represented.
Whites were 20% over-represented. Males were 12% over-represented, meaning females were 12% under-represented.
Part of the Public Transportation System
Sixty-four percent of riders said they used shared micromobility to connect to public transport, and public transport agencies reported multiple ways in which they were furthering the integration of bike and scooter share schemes into public transport networks. However, only 13% were providing direct funding support.
Consumers are keen for further integration. Global research from the University of St Gallen found riders would be willing to pay an average of 22% more for a monthly transit pass that includes shared micromobility, and 25% more for a single transit ticket that includes 10 minutes of shared micromobility use.
Sixty percent of share schemes are privately owned, 28% publicly owned and 12% nonprofit owned.
Rider charges only generated just over a quarter of all revenues, at 27%. Almost half of all revenues, 49%, came from sponsorship and advertising. Fifteen percent was public funding and nine percent from all other sources.
The top three running costs in order were:
- Rebalancing and recharging
- Vehicle maintenance and repair
- Insurance, credit card processing fees etc.
Europe Also Growing Fast
As the following map shows, the number of e-scooter schemes in Europe has grown by approximately 31% over the past 15 months.
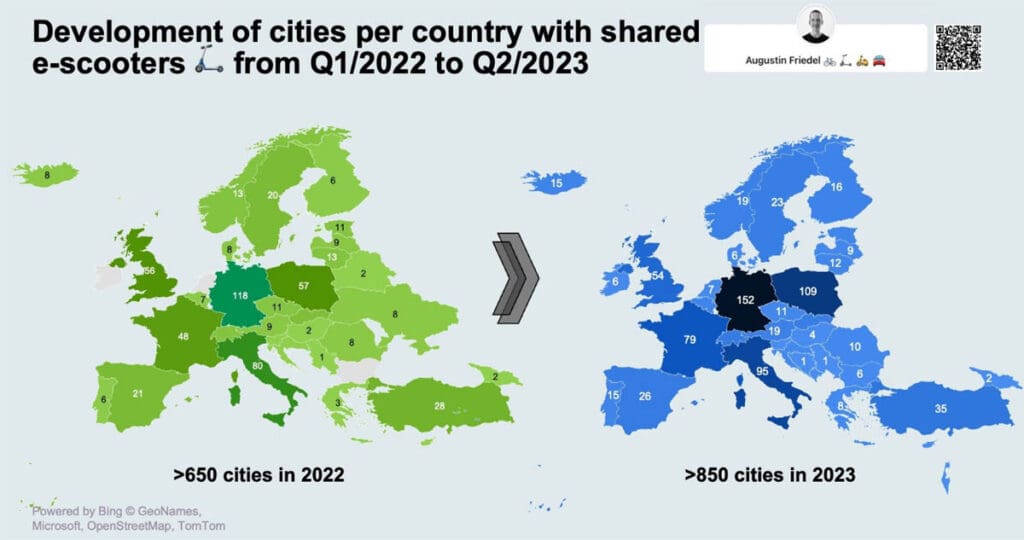
Germany is leading the way, followed by Poland, Italy, France, the UK and Turkey.
According to Micro-Mobility for Europe, a coalition of the largest share scheme companies, there were 700,560 shared e-scooters in Europe at the end of 2022 compared to 285,000 in 2021. This dwarfs the number of shared e-bikes at 79,917 at the end of 2022.
Even more remarkable was the rate of growth of e-scooter trips, from 14 million in 2021 to over 240 million in 2022. E-bike trips totalled 28 million in 2022.
E-scooter journeys averaged 1.9 km for a total of 460 million kilometres, while e-bike trips averaged 2.6 kilometres for a total of 74 million kilometres.
Meanwhile, research company Flutuo reported that share scheme companies earned 3.1 billion Euros in revenue (A$5.2 billion) in 2022.
NABSA Push for Charging Facilities
In mid-August, NABSA released a report highlighting the importance of including shared micromobility charging stations in overall efforts to build grid capacity for electric vehicle charging.
The document demonstrates a multimodal approach to transportation electrification and seeks to encourage partners and stakeholders at all levels to think across sectors and modes as they work toward transportation decarbonisation.
The ClimateWorks Foundation, that supported NABSA production of the report, said it is vital to look for “synergies in places like charging infrastructure to reinforce multi-modality and efficiency and connectivity across electric transportation of all shapes and sizes.”