2021 National Survey Shows Increases in Cycling
![]()
Canberra, ACT
Has cycling activity increased in 2021 compared to previous years?
If you guessed yes, you’d be right, but not by as much as you might have imagined, and in some cases, the increase only brings levels back to where they were a decade ago, following years of gradual decline.
How do we know? The National Walking and Cycling Participation Survey provides insight into walking and cycling activity across Australia and is a successor to the National Cycling Participation Survey which was conducted biennially from 2011 to 2019.
The survey is conducted by phone using a database carefully selected based upon the ABS (Australian Bureau of Statistics) Census of Population and Housing 2016 across capital city and regional areas. A total of 4,618 households containing 11,906 people completed the survey. The survey fieldwork was conducted between March and June 2021, with interviews spread out over a period of several weeks to minimise the effect of local, short periods of unseasonal weather.
In this article, we will focus upon the cycling results, plus a brief look at other personal mobility devices. You can see the complete national survey report here. There are also stand-alone reports for each State and Territory available as well.
In all cases with the following charts, where you see a vertical line with ‘T-bar’ ends above and below each data point, that is the 95% confidence interval. (This is based upon two standard deviations from the mean – a statistical measure that is determined by a range of factors, including the size of the sample ie. the number of people surveyed for each question.)
Cycling Participation
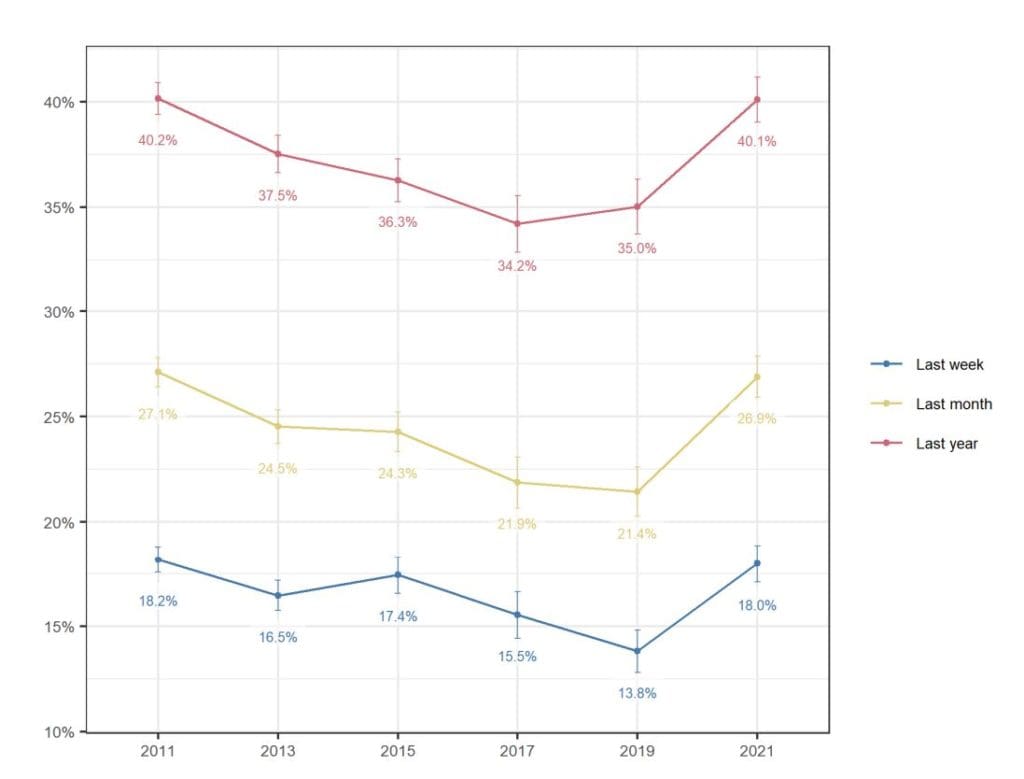
How often do Australians ride a bike? For 2021 the answer is 40.1% rode at least once in the previous year, 26.9% rode at least once in the previous month and 18.0% rode at least once in the previous week.

Cycling Participation by State
When drilling down to a state and territory level, you can see that there’s a significant difference between the most cycling friendly and least cycling friendly states. The exact order varies between the three groups but ACT, NT and WA share the top three spots every time, whilst NSW runs dead last in all cases.
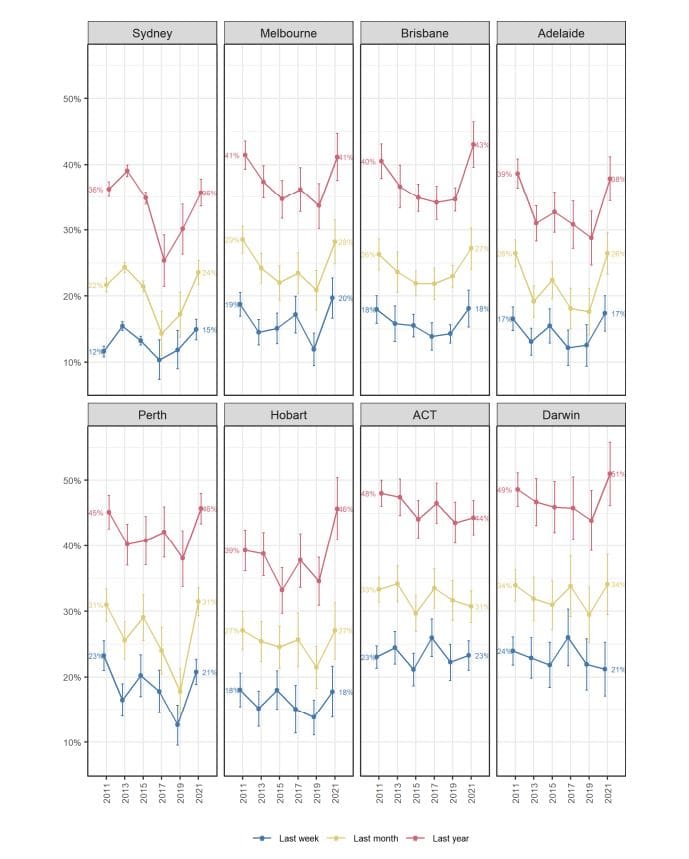
Cycling Participation by City
Being such a heavily urbanised nation, with over 66% of our population living in the eight capital cities alone, it’s interesting to compare cities directly. (Canberra comprises almost all of the ACT’s population and is listed as ‘ACT’).
Darwin comes out on top, followed by Canberra. Sydney is last in all three frequencies by a significant margin. These results are for the greater metropolitan areas of each city. This particular survey did not go down to the local government level, but the other data shows that within Australian cities there is a huge variation in cycling participation which is highest in the inner cities and lowest in the outer suburbs.
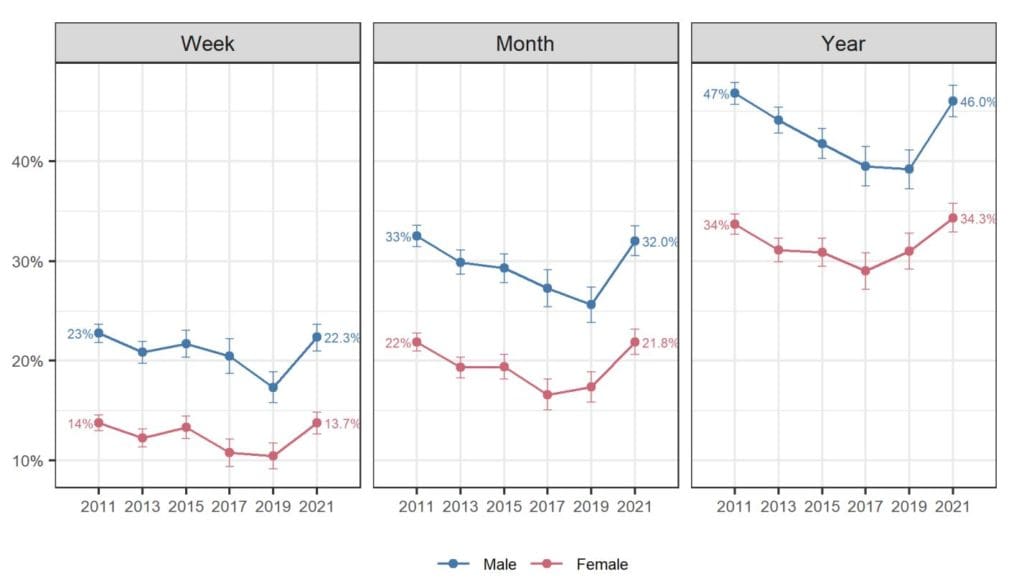
Cycling Participation by Gender
Results by city may have been slightly surprising, but there are no prizes for guessing which gender rides more often. Multiple studies and data sources show that the more cycling friendly a country or city is, the greater the female participation, to even slightly above 50% in some cases such as the Netherlands. Conversely, the more cycling hostile a country is, the lower the female participation, such as car dominated countries like the USA and Australia.

Cycling Participation by Age
Despite other research showing that the number of children who ride to school has been declining for decades, children are still far more likely to partake in some form of cycling than any other age group.
As adults, cycling is less popular for 18-29 year olds than 30-49 year olds before dropping away for 50+ year olds.
Cycling Participation by Purpose
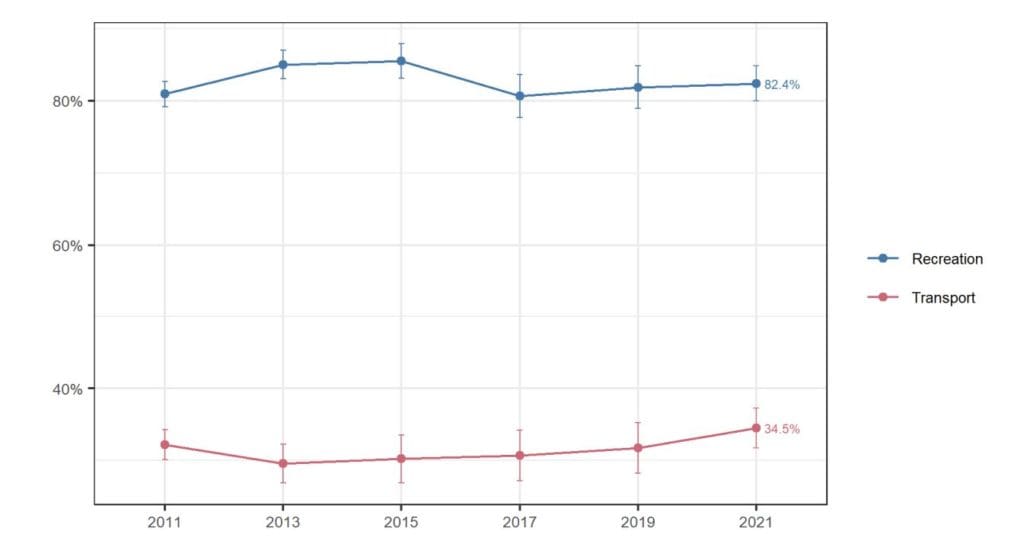
Far more people in Australia ride for recreation than for transport. Some may do both, hence the total for the two purposes being greater than 100%. Just like the gender imbalance, this is another classic indicator of how safe cycling is in any given country, with those where cycling is safer having a much higher transport cycling percentage.
But those selling bikes for transport and urban cycling advocates can take some encouragement from the fact that the percentage of transport cycling has been growing since 2013 and at an accelerating rate over the past four surveys. Perhaps the rise of e-bikes is having some impact upon these figures, as well as people looking for alternatives to public transport during covid.
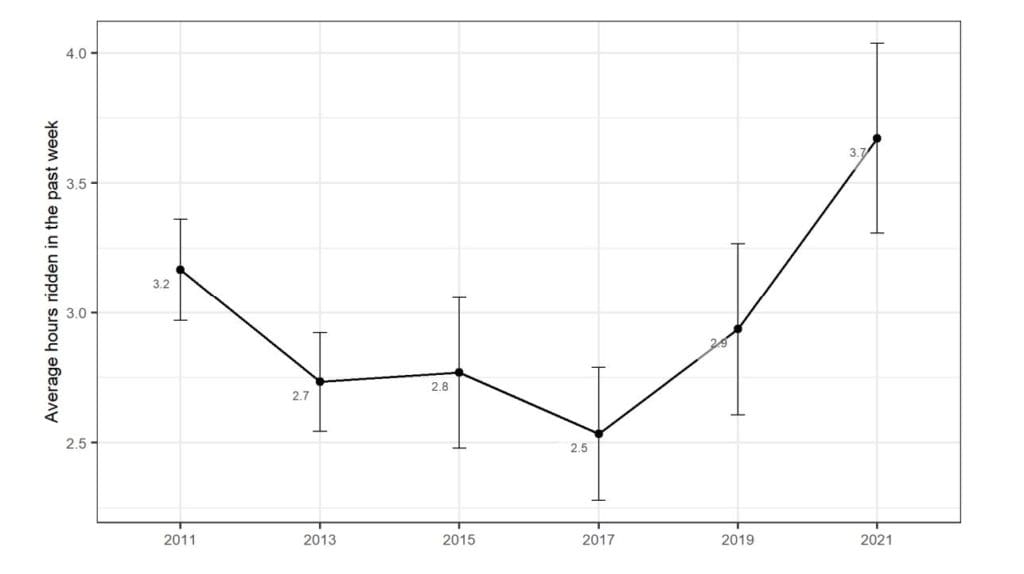
Cycling Participation by Duration
Saying whether you’ve ridden at all in the past week, month or year only tells part of the story because a ride of five minutes or five hours both count as ‘yes’. Asking about average hours ridden in the past week reveals a much more dramatic increase in cycling activity.
Riding Of Scooters and Other Vehicles
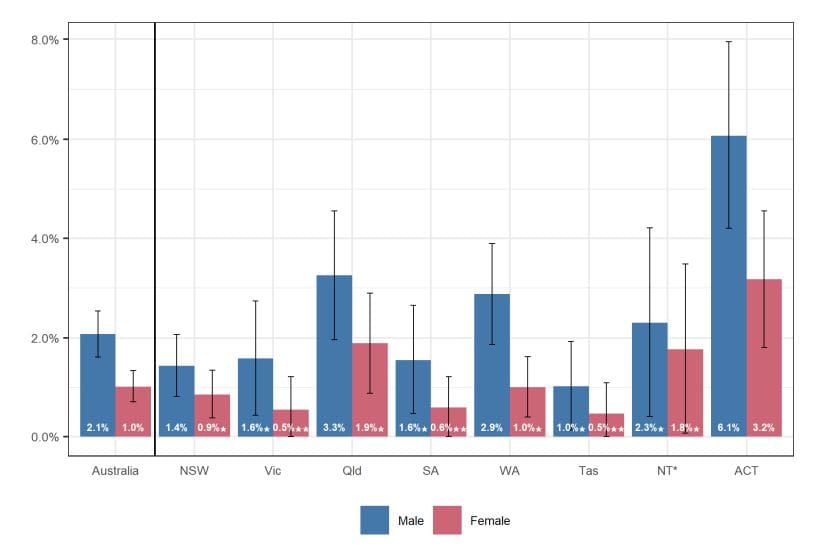
This year’s survey added a new question asking if the respondent had ridden an electrically assisted rideable such as an e-scooter, e-skateboard during the previous week.
It’s interesting to see that the only two jurisdictions in which these vehicles were legal to ride for private use at the time of the survey, ACT and Queensland, had the highest results. In some other states, e-scooter share schemes, many quite small and localised, were legally operating at the time of the survey.
In all other cases, respondents would have been admitting they were doing something that is illegal in their state or territory. Quite apart from arguments that the laws are out of date, you could reasonably speculate that this may have lowered the number of those prepared to respond ‘yes’.
From the response you can also see that male participation is significantly higher in every state and territory, mirroring the gender split for cycling.

Willingness to Consider Cycling
Roger Geller, a former bicycle coordinator for the City of Portland in Oregon, USA conducted a study which has since been much quoted and adopted around the world in which he characterised the entire population as belonging to one of four groups when it came to cycling ‘strong and fearless’, ‘enthused and confident’, ‘interested but concerned’ and ‘no way no how’.
This graph in the National Walking and Cycling Participation Survey follows that concept, and even uses a similar colour scheme and chart style, but the specific questions and classification names are slightly different.
The small percentage in blue for ‘confident’ selected this statement to best describe how they ride their bicycle in the presence of motor vehicle traffic, ‘I prefer to use the most direct and convenient way, regardless of traffic.’
Those who selected ‘I prefer paths or quiet streets and am willing to take a longer way to avoid busy roads’ were labelled green for ‘cautious’. Those who selected ‘I would never ride my bike on a road’ were labelled yellow for ‘interested’. The rest were labelled red for ‘not interested.’
This chart appears to broadly correlate with the participation rates by state and territory, with ACT and NT having the largest combined areas of blue and green, at 25% and 27% respectively. Meanwhile, NSW, the worst cycling state in Australia, had the lowest at just 17%.
The overall Australian average was just 19%. If you take a ‘glass half empty’ perspective, you could say that this chart, reinforced by all of the others in this report, is a damning indictment of how we have built our cities and towns to facilitate the movement and storage of motor vehicles at the expense of all else, including cycling.
If you’re a ‘glass half full’ optimist, you could say that it shows just how much potential for cycling growth there still is in this country.
Thanks to CWANZ (Cycling and Walking Australian New Zealand) for publishing this data. All images are taken from the CWANZ report. You can find out more about CWANZ here.