Why Are Some Countries So Much Safer for Cycling Than Others?

Washington DC / USA
The USA’s National Transportation Safety Board (NTSB) recently published its first bicycle safety report in 47 years.
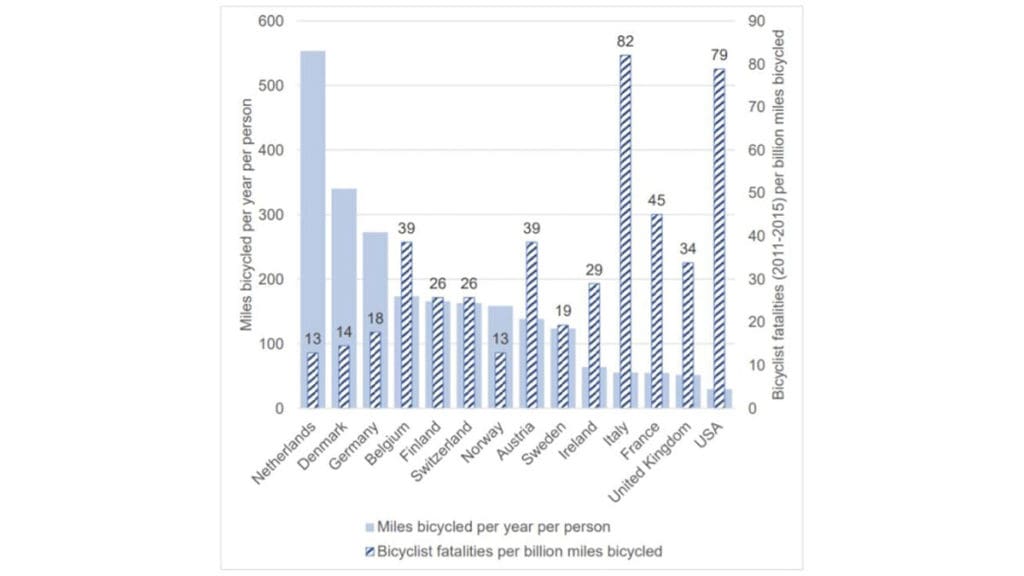
Although, as you’d expect the report is focused upon the USA, we found this interesting chart (below) that shows a comparison of both the popularity of cycling and the death rate across 14 countries 13 of which are European, plus the USA.
As you can see, there is a strong inverse relationship between the amount of cycling and the death rate. In other words, for example, cyclists in The Netherlands and Norway, the two safest countries, were over six times safer, in terms of death rate per billions of miles cycled, than cyclists in the two worst countries, the USA and Italy.
Conversely, cyclists in The Netherlands rode about 550 miles (880 kilometres) per person per year, compared to just five kilometres (approx.) per person per year in the USA, a 110 fold difference.
Unfortunately, Australia is not included in this chart and we were unable to find comparable data for Australia. However, in searching for this data we did find this comprehensive report on cycling safety in Australia.
The question that can’t be directly answered by the data in this table or the overall NTSB report is why safety per distance cycled is better in countries where people cycle more.
We suspect that ‘safety in numbers’ is only one of an array of factors including the quality of cycling infrastructure, attitudes of motorists, typical size and design of motor vehicles and more.
