New Technology Shining Greater Light on Close Passing
![]()
Adelaide, South Australia
A new study using Adelaide-developed technology to provide definitive figures on the issue of motorists passing close to cyclists is preparing to go public with its initial results.
Project Velograph, being conducted by the University of Adelaide, is hoping to have a map up and running on its website from next month, showing popular routes among its volunteers and incidents of near misses.
Around 200 cyclists in Adelaide, Melbourne and the ACT have signed up to the project since it was launched in mid-February and organisers are aiming to recruit 1,000 volunteers during its initial 12-month period.
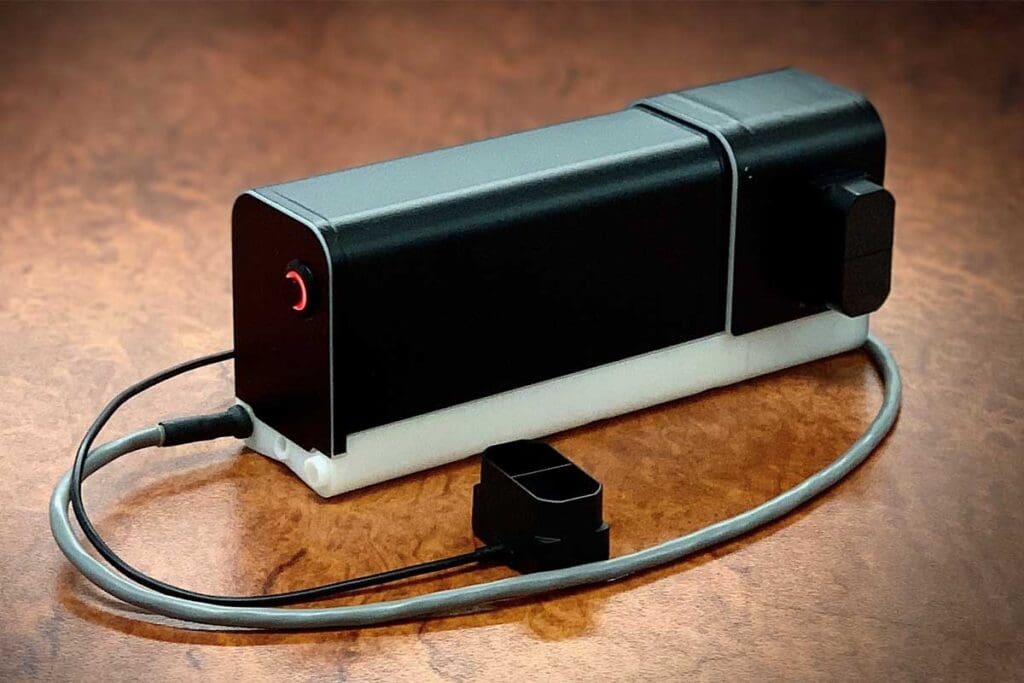
The study uses a unique device that has been developed inhouse by the university and uses two sensors to measure and record vehicles overtaking the project’s volunteer cyclists.
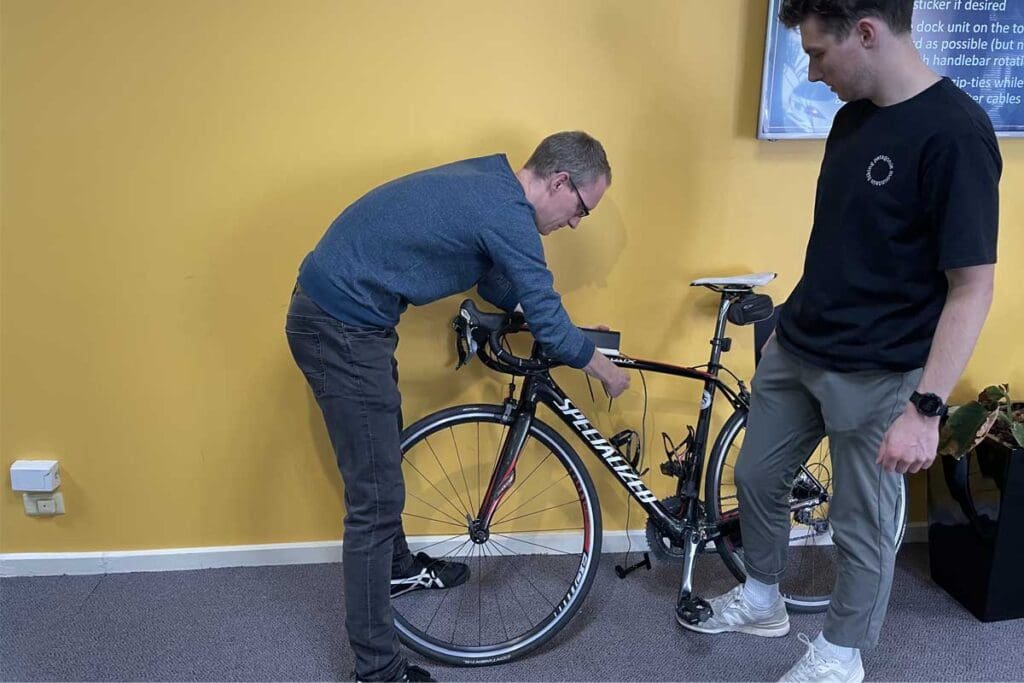
The Velograph is mounted on the top tube of the cyclist’s bike and has a sensor built into the body of the device, as well as a rear sensor connected to the seat post or saddle. It compares data from the two sensors to identify when the rider is in motion, which they are being overtaken and the distance to the passing vehicle.
Both sensors use infrared beams capable of recording data 50 times a second, compared to 10 times per second for the ultrasonic sensors used on a similar units developed overseas.
The project leader, research fellow Jamie Mackenzie, said this greater frequency provided more reliable readings of the distances to vehicles.
Volunteers must turn the Velograph on at the start of the ride, and off at the end, but otherwise the device operates autonomously. Participants can then download the ride’s data onto a computer and upload it to the university’s Project Velograph database.
Jamie said while there have been lots of studies into passing distances involving cyclists, they have brought conflicting results.
“That includes studies into whether bike lanes increase passing distance. While some say they do, others say they don’t,” Jamie said.
“From a statistical point of view, that suggests those studies haven’t captured enough data and there’s some factor they haven’t captured, such as road width.”
Since the units were first deployed on 10th February, 81 volunteer riders have uploaded data, recording 1,854 trips for a total of 15,500km travelled and 37,322 detected passing events.
Collaborations with Advocacy Groups
The university’s Centre of Automotive Safety Research is conducting the study in partnership with Adelaide-based company Insight Via Artificial Intelligence and cycling advocacy organisations Bicycle Network and Pedal Power.
It has approximately l0 Velographs ready to deploy in Adelaide, while Bicycle Network has around 60 of them for the Melbourne arm of the project and Pedal Power is operating 10 in the ACT.
Jamie and his team spent two years developing, manufacturing and testing the Velograph, which using infrared beams to detect adjacent vehicles.
He said they created a prototype in 2017 after the SA parliament adopted legislative changes, “almost overnight”, to introduce a minimum distance for passing cyclists.
“As researchers, we were a bit perturbed by that because we didn’t have a chance to collect data before they made the change,” Jamie said.
The prototype was used for an initial proof of concept trial in Melbourne later that year, followed by a deployment of 20 units, using an updated model, in the ACT in 2019.
He said Project Velograph takes a relatively simple methodology to quantify the incidence of close passing of cyclists.
“Just having data for specific roads – that people can look at and understand how some routes are better or worse than others – is super powerful.”
While previous studies have sought to identify factors influencing passing distance, Project Velograph simply aims to “get out there and measure distances along all the popular routes”.
“Then we will have the empirical data to say, ‘on this road, passing distances are not good,” Jamie said.
“That can then be used to go to the road authorities and say ‘here are the problem areas in your jurisdiction. You probably need to look at ways to fix that’.
“Just having data for specific roads – that people can look at and understand how some routes are better or worse than others – is super powerful.
“It can then be used for pure research to identify the factors affecting passing distances, as well as many other potential applications.
“They might be apps so cyclists can pick safe routes to get from A to B, or before and after data to show whether traffic management measures have improved passing distances or not.”
Project Velograph received initial funding through the Federal Government’s Road Safety Innovation Fund, bolstered by additional assistance from the ACT Government to deploy units in Canberra.
The project’s early findings will be collated in a report to be finalised in June, as part of the Federal Government funding.
However, data will continue to be collected in the ACT until next March and the team in Adelaide plans to continue until at least January.
“We want to go for at least a year so we can get seasonal effects. But we’re hoping to get continuous funding so we can keep rotating these data collection devices among cyclists non-stop,” Jamie said.
“We would like to have them out there as much as possible and, in time, we might see if we can do some targeted recruiting to ensure we get a broad variety of riders.
“It’s really important for this study to get as many different people as possible, which is why we provide them for four week and then get them back to supply to someone else. That helps us get a lot of different viewpoints and experiences.
“You want a representative sample of what’s going on in the real world.”
He said there are also variations in how different demographics ride – the routes they take and the way they interact with traffic – and the ways in which drivers typically response to different types of riders.
“For example, if drivers think you’re a confident rider, there’s a tendency for them to pass more closely,” he explained.
“There was one study that showed female riders are given more space. Maybe we can drill into that and see if it really is the case.
“We are tending to get a large number of volunteers from older demographics at the moment, just because they are the people who will respond to advertising, and have time to come in and get the units fitted in the middle of the day.”
Jamie said the project team will be looking for some younger volunteers and will organise fitting sessions at times that are more likely to suit them.
“We have done one weekend session and plan to do more, as well as some evening sessions.”
Jamie says he expects a boost in volunteer numbers once the online map goes live and, as it’s regularly updated, people can start to see trends.
He said for privacy reasons, the map will not display the same level of detail as the data available to the researchers.
“The map will not show minor roads where maybe just one person has ridden, which could identify that rider.
“Instead, the public map will show the popular routes, where we can say 10 people have ridden down this road and this is the average passing distance. And that is really the essence of what we’re trying to show.
“Once we have the public map operational and we can show what’s going on, we’ll be more active in getting out and talking with groups we believe can benefit from the data, such as app developers.”
To volunteer or for information, visit the Project Velograph website.