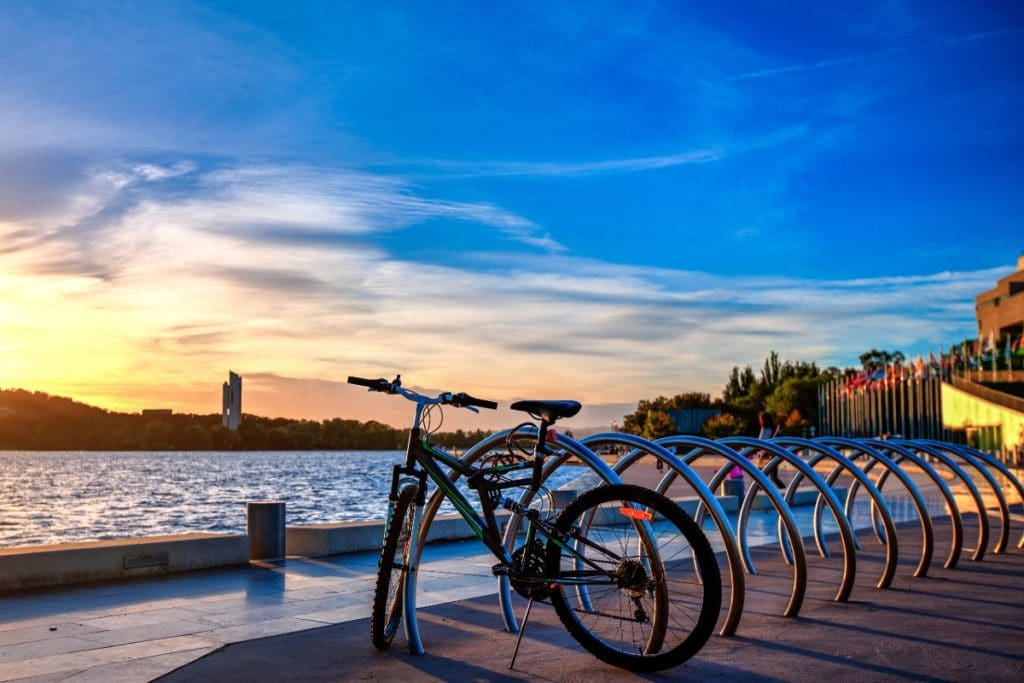
Canberra Ranks as Australia’s Best Cycling City

Boulder, Colorado, USA
Leading USA based cycling advocacy group PeopleForBikes has just released its fourth annual City Ratings report.
City Ratings scores result from combining a city’s Network Score and Community Score. The Network Score, which is worth 80% of the City Ratings score, measures the quality of a city’s bicycle network. The Community Score, which is worth 20% of the City Ratings score, measures how people feel about biking in their city. PeopleForBikes releases annual City Ratings results each June.
The 2021 City Ratings showcases a new way of calculating scores that emphasizes the importance of building safe, comfortable and connected bicycle networks. The revised City Ratings incorporates only two inputs: the quality of the bicycle network via the Network Score, and community perceptions of bicycling via the Community Score.
A city’s Network Score comes from PeopleForBikes’ Bicycle Network Analysis, or BNA. The BNA is a data analysis tool that measures the quality and connectivity of a city’s bicycle network. A bicycle network is defined as the system of paths, trails and streets that someone riding a bike can use to access everyday destinations, just like a road network serves vehicles or a sidewalk network serves pedestrians.
A city’s Community Score comes from PeopleForBikes’ Community Survey, an annual online survey to understand people’s perceptions of biking in cities where they live, work and play. While creating safe, low-stress streets is critical to getting more people riding bikes, it’s also important that people feel like biking is a safe and convenient choice for transportation and recreation.
You can see more about the extremely detailed assessment process here.
Kyle Wagenschutz, Vice President of local innovation at PeopleForBikes, said: “We focused on bicycle networks because research shows that the best cities for bicycling have safe, comfortable, connected bike networks that allow riders to access the places they need to go, like work, school or local businesses. It really is as simple as, ‘If you build it, they will come.’ Building better bike infrastructure is the key to increasing ridership, improving safety and working towards equitable mobility.”
This year’s ratings have grown to include 660 cities in the United States, as well as 30 European, 42 Canadian and 35 Australian cities after a recent expansion to the programme.
City Ratings is a key component of the PlacesForBikes programme, which provides measurement tools and guidance to help U.S. cities develop the best places for cyclists.
PlacesForBikes has been given a grant from Trek Bicycle Corporation, as well as contributions from other bike businesses, foundations and individuals.
Australian Results
Before listing the Australian results, it’s important to point out that these are based upon local government areas (LGA’s) not total city areas.
For example Sydney, which rates highly, is only referring to the City of Sydney LGA which covers the city centre and the innermost eastern, western and southern suburbs. Likewise for the other major cities, they’re referring to the city centre areas. Some of the suburban local government areas are also in the ratings.
| 1 | Canberra (ACT) | 59 |
| 2 | Alice Springs (NT) | 50 |
| 3 | Melbourne (Vic) | 49 |
| 4 | Sydney (NSW) | 48 |
| 5 | Eurobodalla (Batemans Bay & south coast NSW) | 48 |
| 6 | Brisbane (Qld) | 46 |
| 7 | Perth (WA) | 45 |
| 8 | Adelaide (SA) | 44 |
| 9 | Unley (inner southern Adelaide) | 43 |
| 10 | Fraser Coast (Hervey Bay, Maryborough Qld) | 41 |
| 11 | Darwin (NT) | 41 |
| 12 | Mount Barker (Adelaide Hills) | 40 |
| 13 | Whittlesea (outer Melbourne) | 40 |
| 14 | Moreland (northern Melbourne) | 38 |
| 15 | Bendigo (VIC) | 38 |
| 16 | Vincent (inner Perth suburban) | 37 |
| 17 | Toowoomba (Qld) | 35 |
| 18 | Geelong (VIC) | 35 |
| 19 | Cairns (Qld) | 34 |
| 20 | Mt Gambier (SA) | 34 |
| 21 | Liverpool (south-west Sydney) | 34 |
| 22 | Rockhampton (Qld) | 34 |
| 23 | Newcastle (NSW) | 33 |
| 24 | Wollongong (NSW) | 33 |
| 25 | Mildura (VIC) | 33 |
| 26 | Charles Sturt (western Adelaide) | 32 |
| 27 | Hobart (Tas) | 31 |
| 28 | Launceston (Tas) | 31 |
| 29 | Gosnells (south-west Perth) | 30 |
| 30 | Whitehorse (eastern Melbourne) | 30 |
| 31 | Parramatta (western Sydney) | 30 |
| 32 | Ryde (north-western Sydney) | 29 |
| 33 | Orange (NSW) | 28 |
| 34 | Port Adelaide Enfield (north-western Adelaide) | 28 |
| 35 | Playford (outer northern Adelaide) | 27 |
Selected Global Results by Comparison
The number one city in the global ratings was Utrecht in the Netherlands with 83. Not surprisingly the Netherlands occupied all top three rankings and five of the top seven.
Australia’s top city, Canberra, was 36th in the overall ratings.
No doubt it would have been far lower if more than just 30 European cities were included.
But even the lowest rated Australian cities did well compared to many in the deep south of the USA which dominated the bottom end of the ratings.
Fort Smith, Arkansas was officially the worst rated cycling city with a rating of 5.
All 29 bottom ranked cities were American. Naples, Italy was the worst of the rest at 30th from the bottom with 13 points. Then another 81 USA cities before Rome with 17 points.
Then followed another 195 USA cities before the bottom Australian city, Playford which is 308 places up from the bottom, or looking at it from the other direction, 353 places from the top.
