Integration & Data
This category includes all data collection from vehicle counts through to on board devices and apps, the processing and use of all data, including live timetables, transport system congestion and capacities, interactive vehicle safety systems and other autonomous systems.
Data Shows Pop-up Cycleways Success
Sydney, NSW Sydney’s pop-up inner-city cycleways installed to help commuters return to work during the pandemic have become so popular that they occasionally overtake the city’s busiest bike paths, furthering calls to make them a permanent fixture. The Pitt Street cycleway has seen an average of 4430 weekly trips since its installation in July, making…
Cycling Up, Speed Limits and Road Toll Down in London
London, UK London has lower speed limits, higher rates of cycling and better cycling infrastructure than most Australian cities. These enhancements flow through to a far lower road toll. Transport for London (TfL) has published casualty statistics that show a continued decline in the number of people killed or seriously injured on London’s roads in…
Canberra Ranks as Australia’s Best Cycling City
Boulder, Colorado, USA Leading USA based cycling advocacy group PeopleForBikes has just released its fourth annual City Ratings report. City Ratings scores result from combining a city’s Network Score and Community Score. The Network Score, which is worth 80% of the City Ratings score, measures the quality of a city’s bicycle network. The Community Score,…
At A Glance – Ebike Sales Boom in Europe
Europe The data below shows the number of ebikes sold in calendar year 2020 and the percentage growth over 2019 sales. Average growth year on year across these countries was 36%. Country Number of Ebikes Sold % increase YOY Germany 1.9 million +43% Netherlands 547,000 +30% France 514,000 +29% Italy 280,000 +44% Spain 212,635 +49%…
First Data Shows Scooter Share in Canberra is Booming
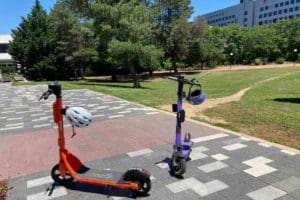
Canberra, ACT Take a quick visit to the centre of Canberra on any sunny day and you’ll immediately notice e-scooters being ridden in every direction. The purple Beam and orange Neuron scooter-share schemes were launched in September 2020 as we previously reported. Each company was given permission to deploy up to 750 scooters in Canberra. On 9th April 2021 ACT Minister for…
Latest Data Documents Massive Cycling Growth in UK
London, UK Pedal cycles travelled five billion miles (8 billion kilometres) on Great Britain’s roads in 2020, 45.7% further than in the previous year, according to statistics from the UK’s Department for Transport (DfT). This is the highest level of cycling on public roads since the 1960s, the DfT said. Pedal cycle traffic saw its highest monthly levels in 2020 during April and May,…
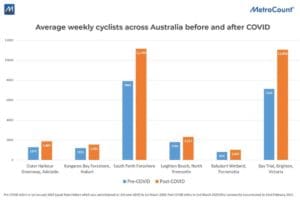
Bike Counter Data Shows Clear Covid Spike
Unpacking the USA’s Bike-Sharing and Ebike Boom
Where Does Your City Rank in Cycling Friendliness?
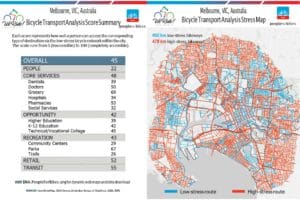
In an Australian first, cycling advocacy group We Ride Australia has applied a new tool to score every Australian capital on the ability to travel by bicycle between key local destinations. The Bicycle Transport Analysis (BTA) project was developed by We Ride’s partners in the USA and uses open source, publicly available data. More than…
Dutch Government Pilots E-Bike Power Zone Technology
“You have been cycling through an empty stretch and you are mostly thinking of yourself and your experience, but now as you come into a built-up area it is about the collective good. By reducing the speed we are making it safer for everybody.” Indranil Bhattacharya – Technology Strategist Electric bike motors will be shut…


