Infrastructure News: Pedestrian Crossing Study, Oldest Canberra Cycleway Turns 50 & Bribey Island Traffic Study
A citizen-driven study is putting Sydney’s pedestrian crossing signals under the microscope and residents are being invited to share their automated crossing experiences.
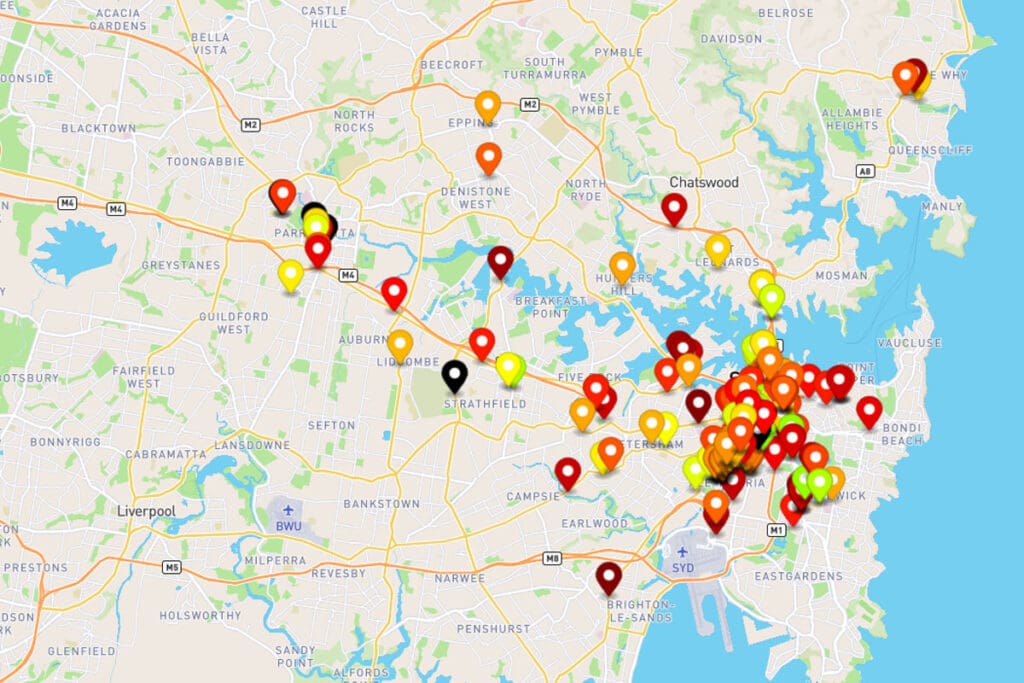
Software engineer and active transport advocate Jake Coppinger has developed a website mapping and detailing the city’s crossing signal network, including the length of time each automated signal remains green, red and flashing red.
Jake says the Better Intersections website highlights the times pedestrians have to wait at each intersection.
He launched the website earlier this year to raise awareness about how wait times impact on pedestrian numbers and push for changes that encourage greater rates of active travel.
“Longer light cycle times increase car throughput and increase vehicle speeds at the expense of pedestrian and cyclist amenity,” he says in a blog on the website.
The site shows the average wait time is around 90 seconds but can be as long as three minutes at some locations.
University of Sydney transport researcher David Levinson, in an address at last year’s Micromobility Conference in Sydney, said longer wait times led to fewer walker because journeys took longer and were more interrupted.
Both Jake and David say when people have to wait longer for a crossing signal they are also more likely to cross during a red light, creating a safety risk.
An interactive map on the Better Intersections site enables members of the public to record the signal cycle times at automated crossings throughout Sydney.
Around 200 people have contributed data to the map so far, providing almost 400 entries, and Jake is encouraging more people to get involved to make the map as accurate as possible.
He said the Sydney network is a good starting point a broader investigation of pedestrian crossing automated signals and their impact on pedestrian numbers.
“Sydney is an important study location as it is the birthplace and development location of the Sydney Coordinated Adaptive Traffic System (SCATS). This traffic management system includes an algorithm that optimises traffic throughput at signals, but it can only measure vehicle volume on the road. It does not measure people on the footpath, and the crossing phase is only called by either a push button or by being automated,” Jake says.
“The NSW Government sells the system commercially to 30 countries and 200 cities around the world. We are quite literally exporting our biases.”
While the SCATS maximum wait time was reduced from 120 seconds to 90 seconds a few years ago, it is still longer than the 70-second maximum waiting time in Copenhagen.
A US Urban Street Design Guide produced by the National Association of City Transportation Officials recommends cycle times of 60 to 90 seconds in urban areas.
Sullivans Creek Cycleway Anniversary
The ACT’s cycling community is preparing to celebrate the 50th anniversary of Canberra’s first official cycle path, at Sullivans Creek, next month.
It is probably still Canberra’s most popular cycle path, even though it’s now part of an active transport network throughout the city, according to the Territory’s peak cycling, Pedal Power.
The ACT Government has given a commitment to upgrade the Sullivan Creek corridor, including removing concrete along the waterway to return it to a more natural state.
“As Canberra continues to grow, it’s essential to address habitat loss, urbanisation, and climate change, all of which pose threats to native species, cultural preservation, and community wellbeing,” the government said.
Pedal Power has called for the bike path to be part of the upgrade, to improve the surface, widen it to five metres and extend it farther north, “to Kenny, through the Yowani golf course to EPIC and beyond”.
Bribie Island Transport Study
Community input is sought for a transport and mobility study for Queensland’s Bribie Island, including provision for active transport.
Public consultation for the study will be open until 17th December, including an online survey and a mapping tool that enables respondents to leave comments.
A series of community drop-in sessions is also being held throughout the engagement period.