More Women and Children are Riding in Sydney
![]()
Sydney NSW
A detailed survey of 5,722 cyclists passing by seven precisely defined checkpoints within the City of Sydney has revealed some fascinating insights.
Normally I don’t run press releases in full, in fact, perhaps one in a hundred of the releases I’ve been sent over the years. But I’m doing so at the end of this article because of the interest and relevance of the information.
I asked the City of Sydney for additional information and was advised that the weekday counts were each for a total of four hours on a single day between 7:30 and 9:30 am for the morning rush hour and 4pm to 6pm for the evening rush hour.
The weekend count was on a Sunday morning from 9am to 12 noon.
The specific Site ID’s and locations were:
8172 Upper Fort St, Millers Point, 2000
8173 236 Wilson St, Newtown, 2042
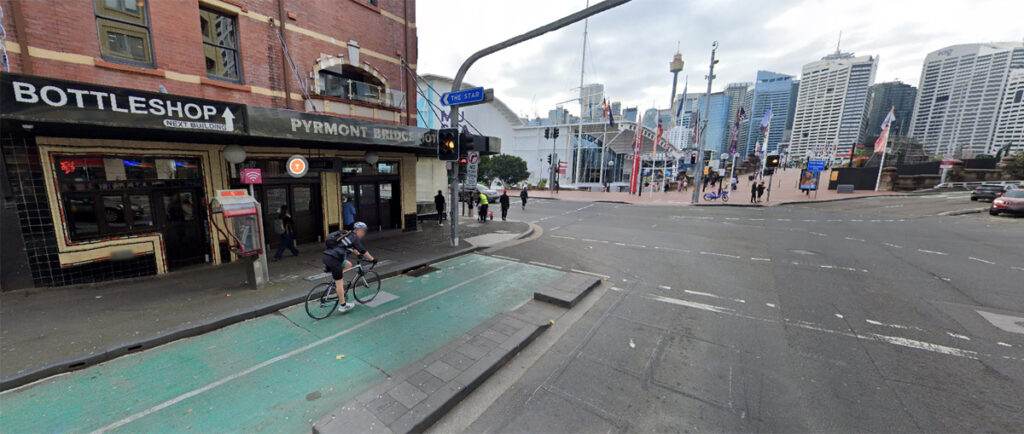
8174 92 Union Street Pyrmont, 2009
8175 18 Gadigal Ave, Waterloo, 2017
8176 713 Bourke Street, Surry Hills, 2010
8177 2 Mary-Ann Street, Ultimo, 2007
8178 35 Oxford Street Surry Hills, 2010
Many readers, particularly those from outside Sydney, may not be aware that the City of Sydney local government area only refers to a very small proportion of the total Sydney urban area. Specifically, it covers the city centre and its innermost surrounding suburbs on the south side of Sydney Harbour.
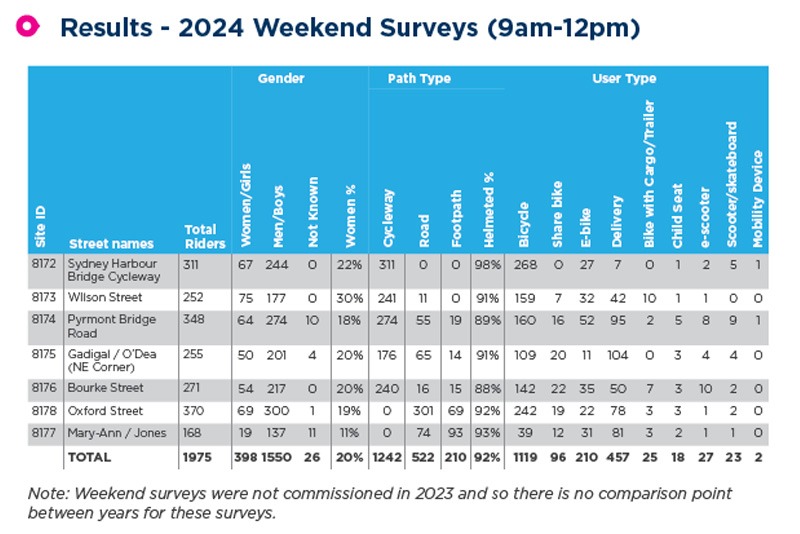
As you can see in the tables above, the detailed data shows a big variance in the percentage of women riding past each checkpoint.
For example, the Bourke St checkpoint, which is part of one of Australia’s first inner city protected bike lanes, has the highest weekday percentage of women at 30%. In contrast 35 Oxford Street which currently has no protected bike lane and is a very busy arterial road with up to six vehicle lanes, has the lowest weekday percentage of women at 17%.
Meanwhile the Sydney Harbour Bridge bike path, which currently has a daunting five flights of stairs at the northern end, is also below the average at 20%.
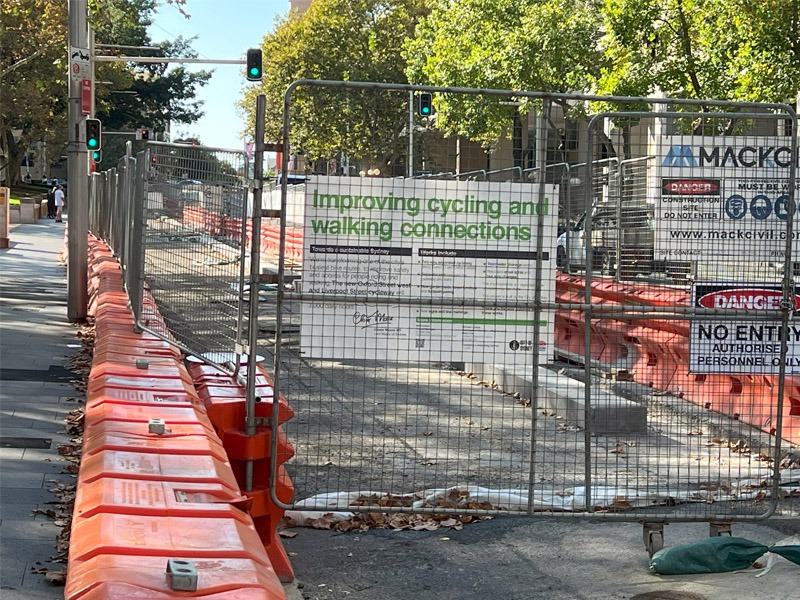
Fortunately, a ramp is soon to be built to replace the harbour bridge stairs and a protected bike lane is currently under construction in Oxford Street.
It will be very interesting to see the counts in future years when these two new pieces of infrastructure are completed. You would not need to be too brave to tip that the percentage of female cyclists passing both checkpoints will increase significantly, along with an increase in total ridership.
Other interesting data the tables show is the percentage of riders using the cycleway, road and footpath respectively. In certain count locations such as Oxford Street, where there currently is no cycleway, the count for that category is zero. But it’s interesting to see in places where there are both options, that the percentage using the cycleway varies significantly.
Bicycle and micromobility advocates may have already read with interest that on Tuesday 28th May, Lord Mayor of Sydney Clover Moore confirmed that she will stand for mayor again in this September’s local government elections. Cr Moore has held the position since 2004 and is the longest-serving lord mayor in the city’s history. We previously interviewed Cr Moore here during the reopening of the College Street protected bikeway.
Thanks to Andrew Booth from the City of Sydney for providing both the original press release and the additional information including the data tables. Here is the press release from the City of Sydney:
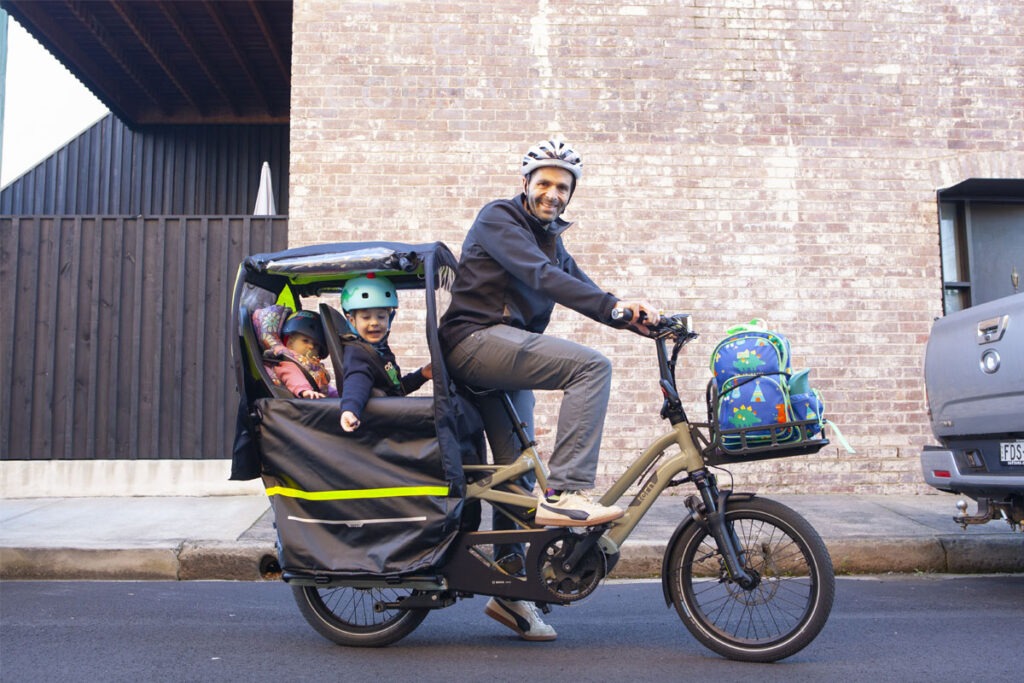
Mums, dads and their kids are increasingly using Sydney’s safe cycleways with new data showing the number of people riding with a child seat has nearly doubled in the last 12 months.
Women are also riding bikes more around the City of Sydney’s area with their numbers increasing to nearly one quarter of all people riding, according to the latest demographic count results which provides a snapshot of local cycleway use.
The City of Sydney released the results of its latest demographic count on the United Nations World Bicycle Day, 3 June, which draws attention to the benefits of using the bicycle – a simple, affordable, clean and environmentally sustainable means of transportation.
“We know lots of people want to ride, but don’t feel safe enough on the roads. That’s why we build bike paths, because it makes cycling a genuine transport option for so many in our community,” Lord Mayor of Sydney, Clover Moore said.
“It’s wonderful to see this infrastructure being used so well, especially by more and more families and women.
“Riding is a great way to get the kids to school, head to the shops to pick up some groceries or visit your local café. People who ride support businesses in their area. Plus it’s cheaper, good for your health and good for the environment.
“Since 2007, we have built 25km of safe, separated cycleways and these new figures show that if you build it, they will come.
“Connecting the network of bike lanes is a real priority for us and our new city budget allocated another $59 million to safe cycling infrastructure over the next 4 years. Construction is continuing on the Oxford Street west and Castlereagh Street cycleways and the Ultimo to Glebe connection, and we have approval to build two new cycleways in Waterloo as well as a link connecting Ultimo to Surry Hills.”
Sydney worker Mike Blackmore has integrated cycling into his commute from Marrickville. He’s found his new e-bike is a great way to get his two kids, Henry and Florence, to daycare and preschool.
“The bike is as fast as driving with half the stress and traffic. Riding is almost twice as fast as the bus and has added incidental exercise to my day. With the electric assist, I can choose how hard I need to push the pedals,” Mr Blackmore said.
“The kids love the bike and it doubles as a vehicle for weekend adventures to parks, playgrounds and the beach. We love the Wilson Street cycleway in Newtown and the recent upgrades nearby have made it even better. We also love to find new bikeways exploring the little parks and back streets.
“I’ve loved that I see other families commuting while we’re out on the bike. It feels like we’ve joined a community.”
The demographic study counted a sample of 5,722 riders on a Tuesday in March at two sites in the city centre, as well as Newtown, Pyrmont, Zetland, Surry Hills and Glebe. People who ride were counted over two hours in the morning and evening commute.
Counts at these sites showed a 19% increase compared to last year’s study.
Compared to counts in 2023:
- The number of bikes with child seats doubled
- The proportion of women represented across the seven count sites increased by 15% with Zetland seeing the proportion of women riders more than doubling
- The number of share bikes being used more than doubled in the areas where the count was undertaken
This demographic count reflects the increase in riding in our twice yearly counts at 68 intersections which show a 15% increase over the last 12 months and a 168% increase in riding since the count began in 2010. Permanent counters on our cycleways continue to show solid growth ranging between 4% and 29% in the last 12 months.
The City of Sydney continues to work with residents to help improve skills and confidence with courses and events.